Tag Archives: infographic

Apple’s Fascinating 43-Year Journey From Small Project To $1 Trillion in Valuation

Is there any more fascinating success story in the world of tech than that of Apple Inc.? What began as a small project in the back of Steve Jobs’ parents’ garage has turned into the first trillion dollar company in the world.

It all started with Apple I, the first Apple product released by Jobs and Apple’s co-founder Steve Wozniak in 1976. Following the success of Apple’s first two personal computers – Apple I and Apple II – the company went public in 1980, and its founders became multi-millionaires overnight.

The 1980s saw the debut of the first personal computer with a graphical user interface (GUI), named Lisa, as well as the release of the Macintosh computer.

What followed, however, was a series of setbacks for Apple, including Jobs’ resignation in 1985. If you want to know what happened next on Apple’s journey to $1 trillion, take a look at the comprehensive infographic below by The Watchstrap.co detailing the success story of the biggest tech company in the world.


8 Apps to Make Moving Abroad Easier

When you move to a new country, it’s all too easy to become overwhelmed by your ever-growing to-do list. This list includes a curated list of eight handy apps designed to help you learn the language, get around, stay safe and make friends in your new home.

Apps can be a great way to build up your language skills by helping you develop vocabulary, grammar and conversational abilities. Offering nearly 150 languages, Tandem is a great option for intermediate-level speakers who want to practice talking with native speakers in a judgement-free environment.

Mobile apps can be a real lifesaver when it comes to navigating around your new hometown. Handy alternatives to Google Maps include Waze and Moovit. If you intend to use public transport a lot, then Moovit: Public Transit is an absolute must-have as it uses real-time information to help you plan your bus, subway, rail or bike trip in many locations throughout the world.

In addition to knowing your way around, it’s also very important to know how to look out for yourself. Help yourself stay safe and alert by downloading a personal safety app. One of our favourites is TripWhistle which enables users to quickly contact local emergency service phone numbers anywhere in the world. 

For many expats, the most difficult part of moving abroad is making new friends. Fortunately, there are plenty of apps designed to connect you with people in your area. One of the most popular is Meetup, which allows you to form groups and plan fun outings with people in your area who share similar interests.

If you would like to learn more about the best apps for travelling and/or moving abroad, take a look at this super informative infographic guide from the team at Hansen & Company.

Read the infographic below to learn more.


What is the future of augmented reality (infographic)

Augmented reality might be fun for now, but the technology has a serious future.

Virtual and augmented reality are growing technologies, and not just in the video game industry, where they are projected to make an annual revenue of $11.6 billion. From healthcare and real estate to live events and education, AR and VR are changing the way we live, work, and learn.

As Forbes journalist Charles Fink says “We’re still 5 to 10 years from everyone walking around with AR/VR devices, but the technology is accelerating at a huge pace.”

VR allows potential home buyers to tour properties through a headset before the property is even finished being built, while AR allows those building homes to look at what a certain type of cabinets would look like in their new homes before they are ever installed. The “Street Peak” realtor app lets users point their smartphone at a home and access all MLS information, a breakthrough in property data accessibility.

AR and VR are entering the retail space, giving brick-and-mortar shopping a run for its money with open-air pop-up stores where users can view products. Clothes shopping is less of a headache with the FX Mirror and Memory Mirror, AR mirrors that simulate what you would look like in an outfit. There are even nail polish manufacturers using AR to allow people to try on a shade before buying.

Healthcare is also being revolutionized by AR. With the help of products like Accuvein, doctors and nurses will be able to find veins and insert IVs on the first try, a task that medical professionals only get right 60% of the time.

Travel and leisure are also seeing surges of innovation with the rise of augmented reality technology. Google Expeditions bridges the gap between education and travel with virtual field trips to anywhere in the world without leaving the classroom. Travel apps like Wikitude are the future of vacation optimization, recommending the best spots to eat and stay.

Learn more about how augmented reality is reshaping industries with the infographic below, provided by Lumus.

Augmented Reality Trends
Source: Lumus

How Netflix Uses Big Data to Drive Success

Netflix has taken over online streaming, but this didn’t happen over night and a lot of work has gone into making Netflix a well-oiled machine. This infographic from Frame Your TV looks at how Netflix has used big data to help drive their business forward.

Even when Netflix was still primarily a DVD-mailing business they launched a competition and offered $1 million to the group who came up with the most efficient algorithm for predicting how customers would like a movie based on previous movie ratings. Even though the winning algorithm has been revised since, the key elements remain the same.

Each time you put on Netflix it’s vital that you find something to watch quickly or you might go on to YouTube or download a movie instead. Netflix estimate that its algorithms save $1 billion a year in value from customer retention as we always find something to watch when we visit the site. Check out the full infographic now.

Family and Teen’s Cyber Security [Infographic]


Have you ever thought about how teenagers are using the technology at their fingertips? More exposed to technology than any other generation before, 91% of American teens access the Internet through mobile devices on a regular basis. This constant use of their online devices has certain consequences including bad uses of technology such as cyber-bullying, sexting, social media addiction and inappropriate content consumption.

The team at Family Orbit, a locator, and monitoring app to keep your family safe, has gathered some surprising stats and has presented them in the infographic below. You will find out some fascinating facts about teenagers online security as well as some signs to detect Internet addiction.

Infographic: Family and Teen’s Cyber Security - An Infographic from Family Orbit Blog

An infographic by Family Orbit Blog

10 Great And Absolutely Free Home Security Apps [Infographic]


We all want our homes to be protected as much as possible from would-be burglars and vandals, and many of us will try to deter such nefarious activity by installing CCTV cameras on our property. But what happens when we leave home for a prolonged while, maybe to go on holidays, for example? We can’t watch over our property then, can we?

Now we can, thanks to the abundance of home security apps that are available for your smartphone or tablet. There are numerous apps that you can download for this purpose, and many of these home security apps will cost you nothing to install. Did you ever think that you would be able to keep an eye on your home from thousands of miles away, simply by looking at a personal handheld device? It might seem like something out of a thriller movie, but now it has become reality, and a welcome reality at that, too.

This infographic from JMC Technologies identifies 10 home security apps that meet with the approval of a security expert and are free to download. Why live in fear when, in the space of a few minutes, you can install a series of apps that will enable you to watch out for your property at anytime from anywhere. It’s a no-brainer, really.

Current Trends in Business Communication [Infographic]


Time does not stand still, and business communication certainly doesn’t, either. New ways of improving the effectiveness, efficiency, speed and quality of communication are constantly evolving, with the methods in which we do business with clients and customers differing significantly from even 10 years ago. For businesses, keeping on top of changes in communication trends is not an option; it’s a necessity.

This infographic by Irish Telecom (www.irishtelecom.com) outlines some of the most prominent current trends in business communication, with interesting facts dotted throughout. For example, web-based tools such as Skype and VoIP are abundant across most businesses in 2016. In its first 10 years of operation, there were 1.4 trillion minutes of Skype calls made. Another growing trend is the Internet of Things, the market share of which is projected to exceed that of PCs, mobile phones and tablets combined within the next year.

These, and other business communication trends, are explored in the infographic. The rate at which telecommunications are expanding can make it challenging to keep up to speed with its evolution, but if businesses fail to get a grip on technological innovations, it could have a damning impact on sales, marketing and customer satisfaction. That is why businesses spent an estimated total of $165.5 billion on IT support in 2015 – spending which reflects another of the current trends explored in the infographic.

business-communication-trends-infographic

Who is Tracking Your Smartphone [Infographic]


Few technological innovations have been quite as successful as the smartphone. Being able to deal with phone calls, text messaging, emails, instant messaging and social networking, plus a host of other functions, on one device is extraordinary. However, smartphones are also fraught with danger, as the sheer volume of data they contain makes them prime targets for spies and hackers to gain unauthorized access.

This infographic by Neon SMS identified the parties most likely to callously track your smartphone and also identifies a number of warning signs to look out for if you fear that your phone is being tracked. These red flags include unexpected shutdowns, making noise when not in use, receiving unusual text messages, abnormally quick battery drain, unusually high data usage and overheating. These, and several other danger signs, could all indicate that a spy or hacker is tracking your smartphone.

You spent good money to buy your smartphone, and continue to pay a standard fee on a regular basis to use it as you would like, so inevitably you will want to protect it from unsolicited access by untrusted sources. Read the infographic below to learn what signs you need to know in order to see if your phone is being tracked, so that you can remedy the problem before it’s too late.

who-is-tracking-your-smartphone-infographic

The History of Microsoft Windows [Infographic]


Are you a PC or a Mac user? Either way, you can’t really deny the success that Windows have had over the years – being the world’s number one operating system for PC users, but success aside, are you aware of all the things Windows have gone through since the launch of their very first operating system?

Thankfully, an infographic has been released by Best STL which manages to detail the rich and ground-breaking journey that the Windows platform has gone through in its 30 year lifetime.

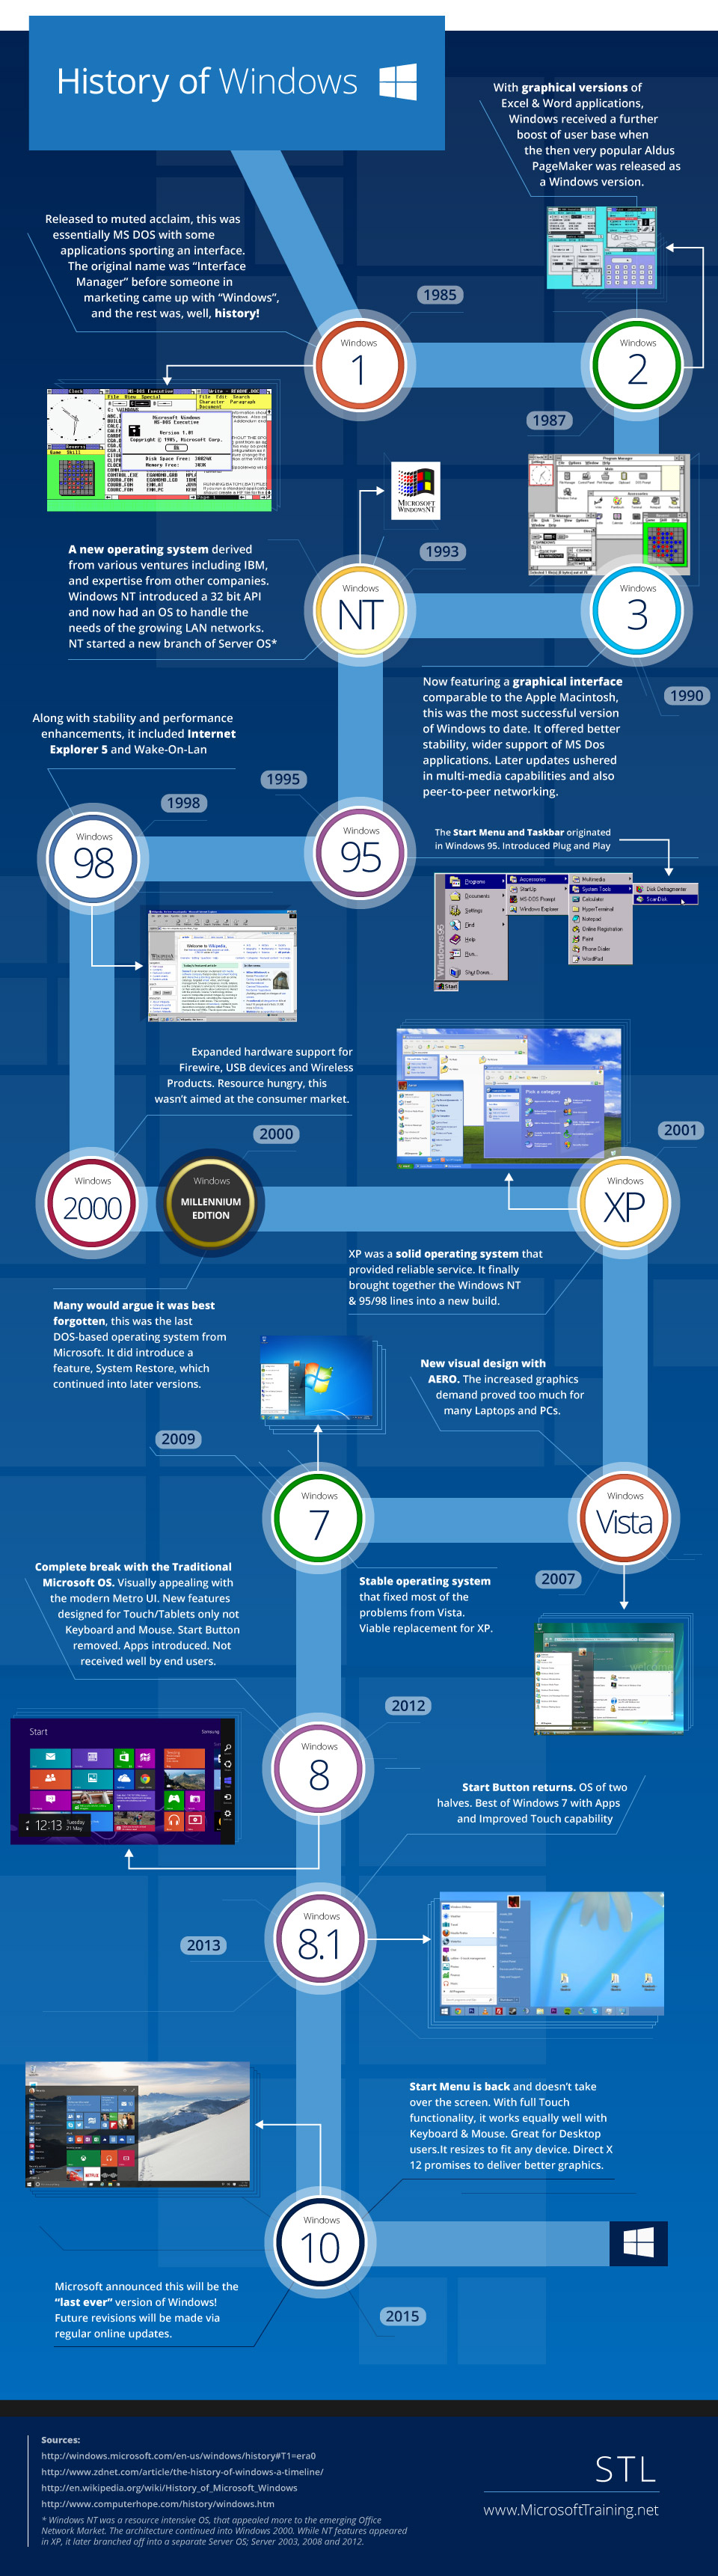
Windows 1 was launched in 1985 – a year after the very first Apple Macintosh computer was released. Primarily run on MS-DOS installations, which allowed pre-existing MS-DOS software and new graphical programs to be run. The reception of the operating system was met with mixed responses from critics, but that was not to stop the company from moving forward in realising the power that Windows had.

Three years later and Windows 2 was released. This marked an important occasion for the company as it was the first system that featured Microsoft Word & Microsoft Excel –essential software that is still widely used today.

In 1990, Windows 3 was released & was the most comparable version to the Apple software, with graphical advancements that made it the most successful version of Windows thus far. It was also the first version to be pre-installed on hard drives by PC-compatible manufacturers, allowing consumers to have the system on their PC straight out of the box.

The success of Windows heightened with the releases of Windows 1995 and 1998 as more and more people started owning computers in their homes. Alongside the release of Internet Explorer, this meant there was more demand for a PC than ever before.

The most popular version of Windows probably still stands at 2001’s release of Windows XP. According to an article in 2009, it was reported as “still having nearly 59 per cent market share” and there is still demand for updates today. Even after the releases of Vista, 7, 8 and 9.

It’ll be interesting to see what Windows 10 brings when it is released at the end of July. Will it be a Windows 98 or XP type release or will it make just as much of an impact as the Millennial Edition or Windows 8 did? Have a look at the infographic below.

History-of-Microoft-Windows

The Evolution of Learning Technologies

learning-book-glasses

Have you ever thought about how technology affects the way you learn? When we think about learning technologies, we normally tend to think about eTextbooks or tablets used by teachers and students in the classroom, but education in technology is not something new.

It actually dates back to thousands of years ago when Egyptians used hieroglyphics to teach phrases, laws and rules or the abacus was used as a counting mechanism. And it has evolved through the years to what we nowadays know as edtech.

This infographic visualizes the most important historic moments of the evolution of learning technologies to make us think about what will the future of education hold for us.

The Evolution of Learning Technologies
The Evolution of Learning Technologies by Open Colleges

What is Productivity About and How to Handle Prohibitors

office-work

We’ve already written about some of the best productivity apps at work, in case you forgot, but how on earth do you manage to stay productive that long? Well, it’s not an easy question to answer but for the most part it is possible to some extent, as long as you can handle much of the stoppers that stand in your way.

And what are these obstacles that are preventing you from doing more?

For instance, did you know that employees spend 20 hours a week online, and 5 hours a week surfing non-work related sites? And that social media costs employers up to $28 Billion each year? Not to mention all the bad communication, as well as cell phones, co-workers or the countless office meetings that we’re going through the day.

Well, It’s definitely something we all need to address and thankfully, SurePayroll and Ghergich & Co just did. Below is an infographic that discusses productivity, along with some other common things that may have a strong effect on it, and what employers are doing about it.

productivity-prohibitors

What did Back to the Future Manage To Predict About life in 2015

back_to_the_future

We all know this 1985/1989 cult film series Back to the Future, right? If you haven’t seen the movie series yet, go and watch now, it’s great. If you did, chances are you probably remember that 2015 is the year that Marty McFly’s time travelling Delorean arrived in the future.

Dr. Emmett Brown, the mad scientist in Back to the Future, promised a world full of flying cars, automated vending, futuristic Hoverboards, self-tying shoes, and plenty more predictions of what life would be like in 2015.

Here’s our list of what the movies got right about 2015 and what they got wrong:

Back-to-the-Future-Infographic


SInfographic is courtesy of Frame your TV

Net Neutrality: Who Is For It, Who Is Against It and Why [Infographic]

net-system

Net Neutrality is one of the most talked about topics at the moment. What exactly does it mean?

Essentially, Net Neutrality is the principle that all Internet traffic should be treated equally. Internet Service providers want to end Net Neutrality and give priority to certain traffic, while the FCC want to maintain Net Neutrality so all Internet traffic is equal.

The overwhelming concern is that if we lose Net Neutrality the Internet as we know it will be gone forever. It will function more like cable television, where service providers are like gatekeepers who present us with the content they want us to see, rather than the user being free to explore the Internet in any way they wish. The Internet needs to remain a level playing field, and the fight for Net Neutrality is about maintaining the Internet as we know it. It is without question a fight worth fighting.

This info-graphic from Pepeyee outlines the main players in the Net Neutrality argument, the benefits of Net Neutrality, and the important wins and losses in the battle to preserve Net Neutrality since Tim Wu coined the term in 2003.

Net-Neutrality

These Numbers Show Exactly Why You Need a Digital Marketing Strategy [INFOGRAPHIC]

Digital Marketing is probably the fastest growing channel for the delivery of sustainable growth and jobs for businesses and individuals. The digital space is experiencing exponential growth with the aim of bringing more marketing potential and money into the online world. This is true across all industries as the economy evolves and more marketers shift money into digital.

Here are some important statistics about Digital Marketing and why you should be considering a digital strategy as well.

Digital-Marketing-Fund

Infographic is courtesy of Dot Com Infoway

Here Are Some Of The Most Important Conversion Optimization Numbers You Should Know About

It is that time of the year again when everyone rushes to sum up the year and plan for the next. So these past few weeks we have been working on getting as many numbers as possible to understand the current conversion optimization statistics. Understanding what marketers are doing, how shoppers are behaving, what devices people are converting on and more importantly what to look forward to in 2015 can be a crucial part of your plans for the upcoming year.

Here are some very interesting numbers coming up from this year’s companies and spenders:

  • 63% of marketers optimize websites based on intuition & best practices.
  • 73% of companies have no idea why consumers abandon their shopping carts.
  • Poor A/B testing methodologies are costing online retailers up to $13bn a year in lost revenue.

Here’s what you all should look at in the conversion optimization statistics infographic below:

2014:

  • What marketers are doing
  • How Customers Are Spending
  • Conversion by traffic
  • Conversion by Devices
  • Mobile Apps Numbers
  • Where & When to Invest in Social Marketing
  • Making Videos Convert
  • Retail Numbers and Stats

2015:

  • What’s next?

Conversion-optimization-numbers-2014


This post originally published on Talia Wolf’s blog

Talia helps businesses plan and execute conversion optimization programs. She runs thousands of A/B tests using emotional targeting and persuasive design to grow their business.


Talia is a frequent keynote speaker at marketing conferences and was recently listed as one of the most influential experts in conversion optimization. Follow her on twitter at @taliagw and learn more about her conversion optimization training programs.

Top 16 Highest Earning Gaming Apps on The App Store [Infographic]

Mobile applications are already an inherent part of our daily life. The average activity includes basic social networking elements, as well as taking photos, watching videos, streaming music and playing video games. Yes, the mobile phone has apart from communication also become a very powerful device for gaming, and game applications are the most popular apps on the App Store, according to any common standard rates.

Due to the growing popularity of these apps, Apple (and Google) has created an ecosystem that allows software developers to create applications that will work on multiple devices at a global level.

There are now over 1,300,000 apps on the iOS App Store, with the top-grossing games to offer free + in-app purchases, selling virtual goods and upgrades to improve a gamer’s performance and overall experience. 

The total revenue of top 200 iOS gaming apps has reached a staggering $9,001,403 collectively, with Clash of Clans taking the first place with a total revenue of $1,415,090, followed by Candy Crush Saga with $989,307 in earnings. The third spot goes to Game of War-Fire Age which makes revenue of $844,334 while the fourth is taken by the Farm Heroes Saga with $343,352 overall.

Take a look at the full results in the infographic below. What do you think? 

Top-Earning-iOS-Gaming-Apps


Infographic is courtesy of Top Apps and designed by Blueberry labs

The History Of Internet Copyright Rules And Why You Should Care About It [Infographic]

copyright-law

You know how it is when you want to download a photo for your website or this wonderful song that you have heard on the radio, and you kinda wondering if they’re copyright protected and where exactly does the borderline go.

As you all probably know, the internet is a dark place when it comes to copyright issues, but the history tells us it has widely changed over the years and helped to further shape copyright law into what it is today. However, the more things changed, the more they’ve managed to remain the same, only just that bit more complex (and restrictive).

A lot of people are just not familiar with the laws or how the Internet works when it comes to copyright laws, and this infographic sketch shows us how it started, right from the very beginning.

While the Internet offers us the ultimate freedom to go and access almost anywhere and download almost anything we want, a copyright Infringement should be taken-in immediately as a possible risk factor.

Have you ever been faced with the dilemma of copyright infringement? What do you think about it?

internet-copyright-law-why-it-is-important

The Next Big Thing in Job Recruiting? Check Out Your Mobile [Infographic]

facebook-mobile

Job hunting is not an easy task for any job seeker. Sometimes in order to get a desirable job you have to try very hard, especially in a tough economy like today. So what do you do to find your next gig? In most cases you will have to spend a good part of your morning browsing through a bunch of job portals online and via newspapers, or alternatively subscribe to receive them by e-mail and fax.

Using social media networks to find a new job requires more than passive use. According to a Linkedin survey 72% of job seekers view company pages for career opportunities while 64% browse for them on the company social media pages.

And while success of the web is evident through its dominance, the importance of mobile devices seems to be gradually taking over. In that regard, 7 out of 10 people search for jobs on their mobile devices with the numbers increasing substantially and steadily in the next two years.

Here’s some more details about this growing phenomenon, curated by the staff.com editorial team.

What is your Mobile Recruitment Strategy? Infographic | Staff.com
Staff.com – Connecting Great Companies with Global Talent

[Image Credit, Flickr, Maria Elena]

Here’s What The Future of Mobile Will Look Like [infographic]

popular-mobile-phones

Mobile is a hot topic these days, everyone has a phone, or a smartphone for this matter, and wants to do all kind of daily stuff with it, from taking beautiful pictures to navigating your car, playing games, sending instant messages, emailing, and surfing the web; it’s all possible, even on a small mobile phone.

With such a promising given scenario, you’re always wondering how things are going to look in the future.

Three Mobile have used current data to predict ways in which mobile technology will change the way we live. Three estimate that by 2016, more than 309 billion apps will be downloaded to devices from the different app stores, by 2017, almost a billion of us will be connected through 4G technology, and that by 2020 more than 50 billion things will be connected to the internet, and by 2025, more than 5.4 billion people will be connected to the internet – 80% via mobile.

Clearly the future is bright for the mobile world and in the next few years we will see global adoption as this technology continues to develop. Check out the stats in this infographic:

The Future of Mobile
View the latest mobile phones on Three

[Image credit: Jon Fingas]